
The term ‘Project Management is self-explanatory as it has everything to do with projects and their management in the organization. Although it may sound like a simple word, it includes a bucket of responsibilities and project management concepts and principles that a project manager must follow to successfully complete and oversee the projects from their initiation phase to their close-out phase.
To support project managers in carrying out their day-to-day responsibilities, there are several project management tools and software that make the project management role a bit more manageable.
Undoubtedly, project management is a growing career with an increasing demand for project managers globally. To understand and learn more about project management, check out our project management certification training courses.
In this guide, let us now take a look at the Gantt Chart tool in project management and everything you wish to learn about it.
What is Gantt Chart?
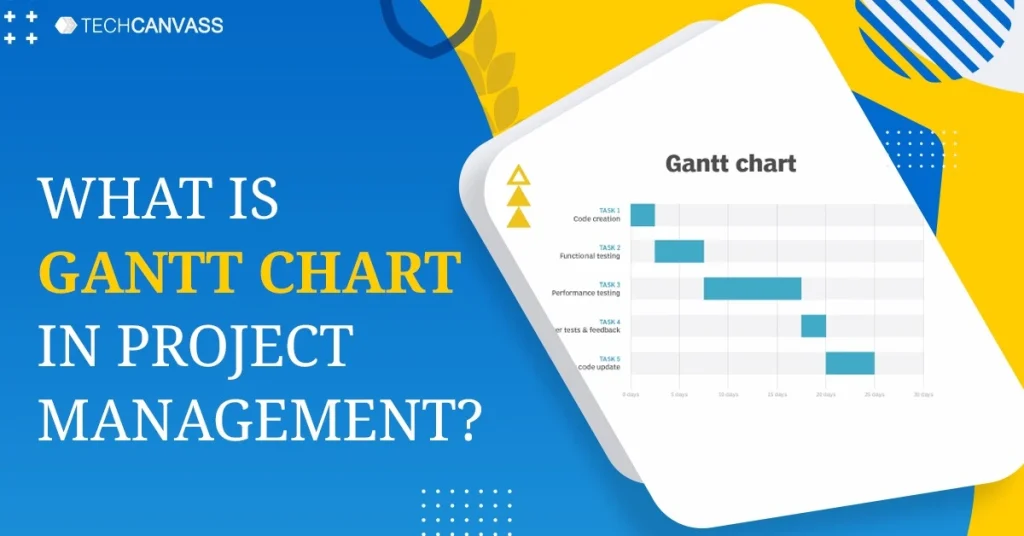
A Gantt chart is a project management tool that displays the project plan and tracks its progress so far. It is in the form of a bar chart and it typically shows project tasks as they are scheduled throughout time. A Gantt chart is a useful tool for project planning, as it shows what work is planned to be completed on various days. Project managers use Gantt charts to see the start dates, end dates, milestones dates, and much more all in a stacked bar chart.
Moreover, it’s easy for project managers to check on the project progress with a quick scan because it’s in a bar chart format. A project manager can easily view:
- A visual representation of the entire project
- All task timelines and deadlines
- Links and dependencies between activities
- Project stages
Also Read – Top 9 Essential Documents for Project Management Success
How to create a Gantt Chart?
To construct a Gantt chart, you must remember that there are two axes, the vertical axis, where you have to list the tasks that must be accomplished, and then there is the horizontal axis, which will illustrate a timeline.
The majority of Gantt diagrams are made in Excel or with project management software, sometimes known as Gantt chart software. If you use Gantt chart software instead of an Excel Gantt chart template to create Gantt charts, you’ll be able to do more than just observe task durations and due dates. A few things that you will be able to do if you are using a Gantt chart software are as follows:
- You can establish a work breakdown structure
- Assign tasks to team members
- Watch project progress in real-time
- Drag & drop timelines to change your project schedule
Gantt charts can be easily created if you use a Gantt Chart software or a project management tool that provides the Gantt charts features.
What is Gantt Chart used for?
Gantt charts are extremely useful for managing projects in the organization. A project manager may use Gantt Chart for the following main reasons.
- To create and manage a large-scale project.
Gantt charts visualize a project’s components and break them down into smaller, more discrete chunks. The resulting little tasks, as well as dependencies between tasks, assignees, and milestones, are scheduled on the Gantt chart’s timeline. Therefore, a project manager can easily create, visualize, and manage large-scale projects with the help of Gantt Charts.
- To determine the logistics and task dependency.
Gantt charts can be used for tracking a project’s logistics. Task dependencies make sure that a new task may only begin after the completion of the previous one. Dependent issues are automatically rescheduled if a task is overdue. This way, a project manager can determine the logistics and task dependency while carrying out a particular project.
- To keep track of a project’s progress.
A project manager can track the status of the project and make changes if necessary with the help of a Gantt chart. Release dates, milestones, and other essential metrics can also be included in the Gantt chart to track the development of any project.
Benefits of Gantt Chart
The reason why Gantt Charts are helpful in project management is due to the following benefits of the tool.
- They make intricate plans easier to design, especially those involving several teams and shifting deadlines.
- Gantt charts assist teams in properly allocating resources and planning work around deadlines.
- They are also used by project planners to keep a bird’s eye view of undertakings.
- Modern Gantt chart software like Jira Software with roadmaps and Advanced roadmaps synthesize data and show how decisions affect timelines.
- You can view the relationship between start date, end dates, milestones, interdependent tasks, and so on.
How to use a Gantt Chart?
Now that you know what a Gantt chart is and what it is used for in project management, it is time we explore how to use one in project management. Here is a step-by-step guide to help you get started with using a Gantt chart.
Create a Gantt Chart
It’s simple to get started with Gantt charts; it’s managing them that’s difficult. To begin, either utilize a template with the help of any project management software or tool that offers the Gantt chart feature or start from scratch using the excel sheet.
Invite team members to the Gantt Chart tool
It’s time to onboard your team members to the Gantt Chart tool by inviting them by sharing the links or adding their email Id.
Begin by adding the task list
You may start enhancing task management in a couple of ways once you’ve invited your team members to the new Gantt chart. Right on the Gantt chart view, you may organize a group call to work on the project plan together. Alternatively, you can pre-populate the task list into the Gantt with an easy import tool or by clipping and pasting the list, so that the tasks and assigns are already filled out when your team gets on the phone.
Assign tasks and duties to team members.
In real-time, you may allocate or re-assign tasks to team members based on their availability. When people are allocated to tasks on the Gantt chart, their names display above the taskbar.
Customize your Gantt Chart
You can personalize your Gantt charts in any way that works best for your organization. Distinct people are represented by different colors on the Gantt task bars, making it easy to determine who is accountable for which tasks at a glance. Others may use colors to symbolize distinct phases of a project or separate teams accountable for a collection of tasks.
Add files, comments, or notes to your document.
You can do so much more than just schedule tasks when your team collaborates on an online Gantt chart creator. At the task level, you may add photographs, videos, links, notes, and comments, ensuring that all essential task work is documented and readily available in one spot.
Keep a track of the project’s progress
The ability to see where a project stands at any given time is one of the best features of using a Gantt chart. Clients, bosses, and other project stakeholders, after all, want you to keep your commitments. You can easily alter the Gantt chart to get things back on track and reset expectations along the way if things start to go off track.
History Of Gantt Chart?
Karol Adamiecki created the first project management chart in 1896. Let’s take a quick look back at the history of the Gantt Chart and how they were created.
- 1896: Karol Adamiecki designs the Harmonogram, a forerunner of the contemporary Gantt chart, as the first project management illustration.
- 1931: The Harmonogram is published by Adamiecki, but it was published in Polish which resulted in limited exposure.
- 1910-1915: Henry Gantt produces the Gantt chart, his own project management technique.
- Today: Gantt charts remain the primary method of project management for all sizes and types of projects
Conclusion
We hope this guide was helpful and you were able to learn everything about the Gantt Chart in project management and how it is a helpful tool for project managers to efficiently carry out the responsibilities and tasks of the project. Ever since the emergence of Gantt Charts, project management has been made a little more manageable for project managers globally.